
FR
DEMONSTRATION • MISSION CONTROL

Demo & samples

Explore the interactive Mission Control preview by sector alongside our two sample documents (simulated data).

Interactive demo

Simulated data

Simulated data — demonstration

PLATFORM PREVIEW • MISSION CONTROL

Your zones live, then a verified report

Switch sectors to see how Mission Control presents zones, thresholds and signal outages.

Multi-stage festival — Urban park
Simulated data — no live connection
Simulation showing 4 monitored zones on Saturday at 9:10 PM (no live connection).
People present (4 zones)
6,140
Instantaneous total — distinct from daily cumulative entries
Stage A Pit density
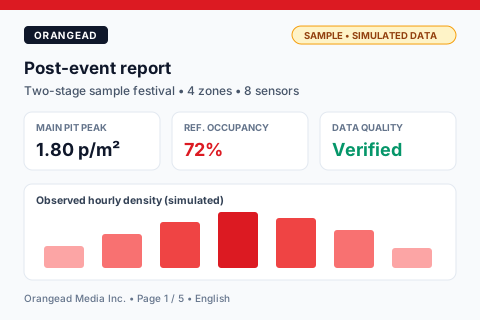
1.8 p/m²
4,320 people across 2,400 m² usable area
Stage A ref. occupancy
72%
Agreed reference capacity: 6,000 people
Sensor feed status
3 / 4 active
1 zone flagged offline (never shown as zero)

Zone map (density & occupancy)

NormalElevatedOffline
Stage A Pit
Usable area: 2,400 m²Ref. cap.: 6,000

Operational scenario

  1. 18:45 PM — Stage A Pit density rises from 1.3 to 1.8 people/m² ahead of the headliner.
  2. 28:52 PM — Agreed operational threshold (70% of reference capacity) is flagged to the Orangead specialist at the security command post.
  3. 38:58 PM — West Footbridge loses network link: UI displays "Data unavailable — last reading 20:58" rather than a false zero.
  4. 49:05 PM — Operations opens the East relief lane; stabilization at 1.75 people/m² is logged for the post-event report.

Recent activity log

  • 21:05 Stage A Pit — Field action logged: East lane opened by operator
  • 20:58 West Footbridge — Feed interrupted — last valid reading preserved (20:58)
  • 20:52 Stage A Pit — Configured threshold reached: 1.80 p/m² (72% ref. cap.)
Methodology

Indicators defined without ambiguity

Example: 60 people present over 100 m² of usable area is 0.6 people/m². If the agreed reference capacity is 120 people, occupancy is 50%.

Passages

crossings / period

Observed crossings of a line or perimeter during a defined time window.

A passage is not necessarily a unique visitor (round trips are counted).

People present

people (instant or interval)

Estimated number of people within an observed zone at a given moment or interval.

Instantaneous headcount does not equal cumulative daily attendance.

Physical density

people / m²

People present divided by actually observed usable floor area (e.g., 60 people in 100 m² = 0.6 people/m²).

Physical density is expressed in people/m², never as a standalone percentage.

Occupancy rate

% of reference capacity

People present divided by a reference capacity explicitly agreed with the client (e.g., 60 / 120 = 50%).

Reference capacity is an agreed operational benchmark, not a universal safety threshold.

Directional flow

passages / direction / window

Observed passages moving in a given direction over a defined duration.

Nearby zones are framed separately to prevent double counting.

Zone presence / screen exposure

seconds or minutes (method stated)

Calculated duration within a defined area, or proof of play paired with surrounding zone foot traffic.

Playback, zone presence, aggregated attention and sales are four distinct measurements.
SAMPLE REPORT (SIMULATED DATA)

Review a complete sample report including Data Quality sign-off

The sample describes the scope, the definitions, the curves and the human quality review.

Sample report (PDF)
  1. Page 01

    Summary, sample venue scope and dates

  2. Page 02

    Definitions: passages, people/m², reference occupancy

  3. Page 03

    Density by zone and observed peaks

  4. Page 04

    Threshold timeline and logged actions

  5. Page 05

    Quality review, continuity and limits